Kiosk
Equality...is the result
of human organization. We are not born equal. Hannah Arendt,
1906 - 1975 German/Jewish/American poet |
Math series
Creating and developing spreadsheets
Where did your money go?
Spreadsheets can help you with your financial calculations.
Develop a spreadsheet to analyze your expenditures for a month,
or for whatever period you like,
and learn the basics of
organizing budgets with key features of spreadsheets:
Open a new spreadsheet
Choose File: Save As and save the file as
Financials.xls.
Make a habit of saving each spreadsheet immediately when
you start because if something goes wrong (such as the dog
tripping over the power cable and turning your computer off)
a saved file is much easier to recover than an unsaved one
Begin to enter information:
Simply click on a
cell and type your entry
If there's already something
there, you don't need to delete it – just start typing and
you will overwrite the current contents of the cell.
Click on cell B3 and type Date.
In future,
when we want you to enter data into a cell, we'll simply
write:
(B3) Date
Don't type the (B3) part; the brackets ( ) ask you to
click/select the cell
Enter the following in their cells::
|
(C3) |
(D3) |
(E3) |
(F3)
|
(G3) |
(H3)
|
(I3) |
(J3) |
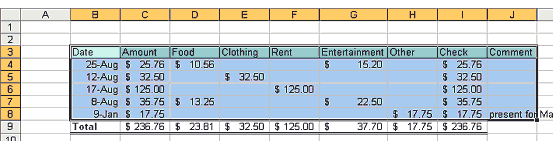
From these headings, you see that we will enter dates and
amounts
then ‘analyze' the amounts into key areas of
expenditures.
Your spreadsheet should now look like:
![]()
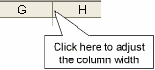 In cell G3,
the word Entertainment is too long to fit the cell, and so
it has been cut short.
In cell G3,
the word Entertainment is too long to fit the cell, and so
it has been cut short.
Here's a simple way to make the
cell wide enough. Double click on the line between the
column headings G and H. This adjusts the column width to
fit the information in its cell (column G).
To perform the same action to a number of cells at once,
they need to be selected.
 Click on B3
then hold down the mouse while you drag across to J3 and
release the mouse.
Click on B3
then hold down the mouse while you drag across to J3 and
release the mouse.
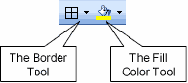
Border tool:
Use the drop down menu of the
Border tool to put a border around all the selected cells.
Fill Color tool:
Choose a color that you like to
mark the cells as headings rather than data.
Light colored backgrounds with dark text colors work
best for easier reading!
Now let's spend some money!
- First, a couple of examples for cell entries
(It would be best if you entered some information of your own, so that you can see the analysis start to take shape for yourself)
In the first row, we will also fix up the formatting as we go and show you how to make sure that the formatting is repeated in the cells below. We start with the date.
(B4) 25/08
As soon as you type 25/08 and press <Enter>
the spreadsheet assumes that you have typed a date,
and formats it as a date
The program also adds the current year to the data that you have typed, which you can see by double clicking on B4. There's good news and bad news in this action of the program. It saves you time, if the date is what you want, but if you didn't mean to type a date, the cell will have been given a date format, which you may have to remove by selecting the cell and choosing Format: Cell: General.
- So on the 25th August you spent $25.76 on a movie ($15.20) and a meal ($10.56)
Enter: (C4) 25.76 (D4) 10.56 (G4) 15.20
It's easy to make a mistake when typing, which
is why we suggest a Check column.
Click on cell I3 and then on the
 Autosum
button.
Autosum
button.
You'll see that the program adds the numbers in G4
and H4.
But you want the Check to add together all the
numbers in cells D4:H4.
Drag the bottom left corner of the selected range
across to D4 and the formula will automatically adjust
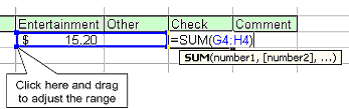
This feature of adjusting the range of a formula is
really handy at times
The numbers that we have typed are all "dollar"
amounts, and the formatting should reflect this.
Select D4:I4 by clicking on D4 and dragging
across to I4
On the Currency Style button (that's the
one with a $ symbol).
Did you notice that there is a small triangular
marker in the top left of cell I4?
Excel thinks that
you might have made an error in your formula
To see the comment, click on cell I4 and then
hover over the
!
box.
You will be told that there are numbers in
cells next to the range that you have chosen.
But we don't want to include the Amount or Date
columns in this summation. It's simply there so that
we can immediately see if our analysis of the Amount
is correct.
You can ask Excel to ignore this
‘error' using the dropdown menu of this warning.
Adding the following data to the table
- Leave Row 9 for later!
There is an error in Row 7 but we will correct that later
also
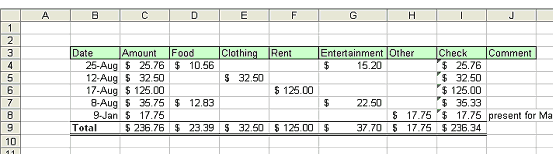
- To complete Row 9 of the table, you need to make:
(B9) Total
(C9) = SUM(C4:C8)
(Use the Autosum Button for this)
Fill handle:
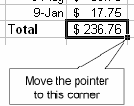 Move the
mouse pointer to the bottom right corner of C9 until it
changes shape and becomes a vertical cross. This is
called the Fill Handle
Move the
mouse pointer to the bottom right corner of C9 until it
changes shape and becomes a vertical cross. This is
called the Fill Handle
While it is showing, you can click down and drag
across to I9 and the formula in C9 will be copied into
or fill all the cells between C9 and I9.
The Fill Handle is a great time saver!
- In our diagram, we have put borders on Row 9.
We did this by selecting B9:I9 and using the Border Tool to add the border that we wanted - Before we fix our error in Row 7,
here's a great technique for highlighting a part of a table that you need to pick out from the rest. Click on cell I3 and choose Format: Conditional Formatting. This allows you to apply a format to a cell if certain conditions are present.
Here, we want the condition to be as shown in the box
below:
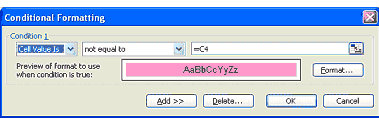
Set the centre box to “not equal to” and in the
right-hand box type =C4.
Click on the Format button, choose the Pattern tab
and select a colour that will show up whenever the
analysis doesn't match with the amount.
Click OK to complete the formatting.
You won't
see anything immediately, but if you use the Fill Handle
to fill I4 down to I9, you'll see immediately where the
error has occurred.
To fix the error, you make:
(C7) 23.25
Both the
error and the warning sign disappear when you make
correction!
Sort feature:
You may noticed that the information
we added to the table is in no particular order.
Excel/spreadsheets can sort information
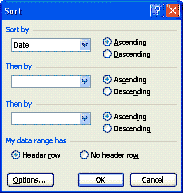 Select
the whole of the table apart from the Totals. That is, select
cells B3:I8 and choose Data: Sort . In the dialogue that shows,
Excel suggests that you should sort by Date because that is the
information in the first column. The program also detects that
your data has a Header Row (i.e. the first row are the names of
the columns in the table). For this data, both these choices are
correct and we only need to click OK to have the table sorted by
date. Otherwise, the program provides dropdown menus to enable
you to change the Sort criteria.
Select
the whole of the table apart from the Totals. That is, select
cells B3:I8 and choose Data: Sort . In the dialogue that shows,
Excel suggests that you should sort by Date because that is the
information in the first column. The program also detects that
your data has a Header Row (i.e. the first row are the names of
the columns in the table). For this data, both these choices are
correct and we only need to click OK to have the table sorted by
date. Otherwise, the program provides dropdown menus to enable
you to change the Sort criteria.
- Choose File: Save
to make sure that you don't loose all your hard work!
You have created a simple financial analysis package.- We'd just like to make one last point. Unlike using
a calculator, where the last number entered disappears
as soon as you start on the next one, the numbers that
you type into a spreadsheet are permanently on view and
you can always go back and change one or two numbers
that might have been entered in error without having to
re-enter all the information. It's a great tool for
financial analysis … and that's just the beginning!
We hope that you will be able to find time to adapt it to your own needs!
- We'd just like to make one last point. Unlike using
a calculator, where the last number entered disappears
as soon as you start on the next one, the numbers that
you type into a spreadsheet are permanently on view and
you can always go back and change one or two numbers
that might have been entered in error without having to
re-enter all the information. It's a great tool for
financial analysis … and that's just the beginning!
 Website overview:
Kiosk guides for learning are a freely accessible educational environment that offers strategies to recognize and realize learning objectives. We accept individual differences without regard to ability and creed; sexual and affectional orientation; caste, tribal and national affiliation; individual, familial and collective history. Our suggestions should be thoughtfully considered for appropriateness and guidance to your situation, relying on elders, mentors, cohorts and/or professionals to achieve learning objectives and outcomes.
Website overview:
Kiosk guides for learning are a freely accessible educational environment that offers strategies to recognize and realize learning objectives. We accept individual differences without regard to ability and creed; sexual and affectional orientation; caste, tribal and national affiliation; individual, familial and collective history. Our suggestions should be thoughtfully considered for appropriateness and guidance to your situation, relying on elders, mentors, cohorts and/or professionals to achieve learning objectives and outcomes.